|
For both subsidized and unsubsidized: 4.45%
Private: 7% It would take about 30 years to pay for a total of $36,425.84 When you add interest, it makes the loans cost even more. Honestly, I feel like the biggest thing I learned is that loans are just a trap. For Subsidized: $100 - 12 years. $150 - About 8.5 years. $200 - 5 years. Unsubsidized: $100 - 30 years. $150 - 15 years. $200 - 10 years.
0 Comments
Synthetic division can be used to find some zeros. The degree can sometimes tell how many zeros there will be, but it is not always accurate because some zeros can be repeated.
Even and odds are similar in the way that they both of symmetry. They also both use negatives to figure out if they are even or odd. They are different in a way that they do both have symmetry, but it is different. To figure out if it is even, you use (-x , f(x)) and to figure out if it's odd, you use (-x , -f(x)). I don't think there are any that will constantly be even or odd. My question is if there are any that will be constantly even or odd.
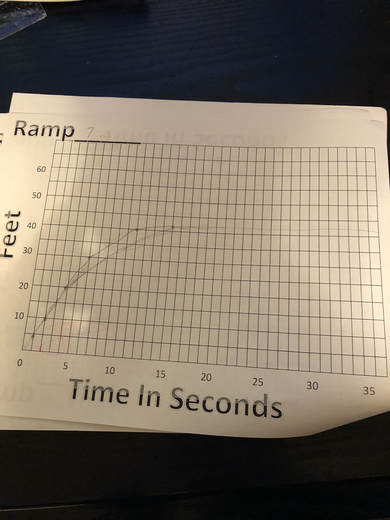
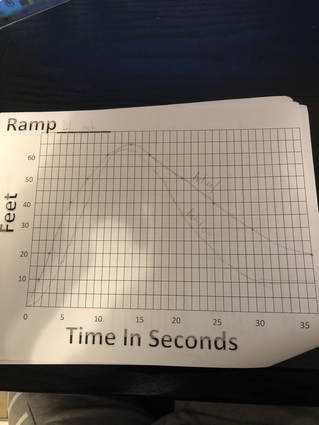
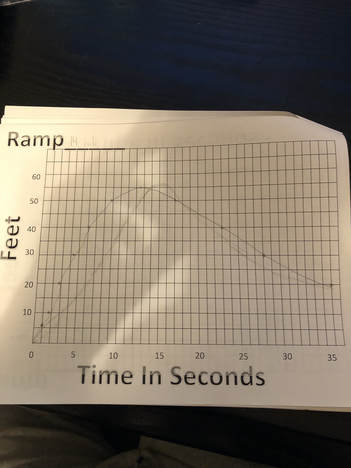
My predictions were a little close, but not very good. They were just different because I really didn't know what to do. The zeroes represent where feet or time was zero. The one that went that went faster and further has the highest maximum, with the slowest and least distance moved has the minimum. The 7 inch one looks the most different because it doesn't really roll back. The 21 inch rises the fastest because it went the furthest in the least amount of time. The 14 inch seemed to roll back the fastest, but the 21 inch maybe had it beat.
 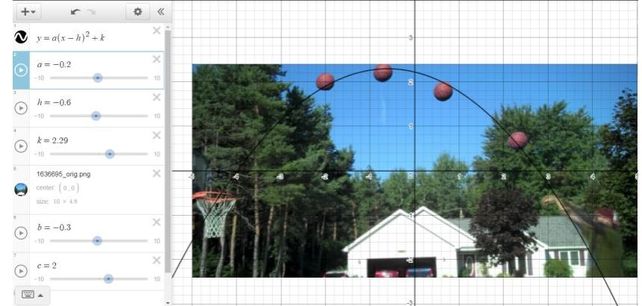 It does look like it will make it into the net, but it may not because the graph doesn't hit all of the balls perfectly. But, I'm pretty sure it will make it.
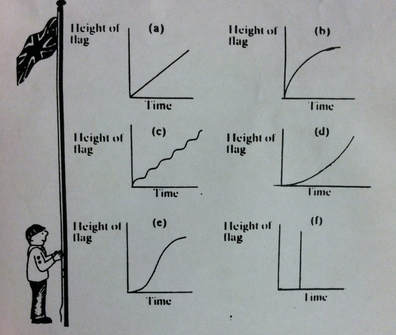 The first graph shows how the flag raises at a steady rate, with no interruptions or stops. Graph B says that the flag is raised quickly when it starts, but starts to slow down as it begins reaching the top. Graph C says that the flag speeds up for a bit, and then slows down. Graph D shows that the flag is raised slowly over time. Graph E is saying that the flag starts out slow, then speeds up very quickly, and slows down again when it begins reaching the top. Graph F is the flag just going straight up in record breaking time.
The most realistic graph would have to be either A or D. Graph A is just showing that the flag is going up at a decent speed with no problems, while D is similar, except that the flag is going at a slower speed, which could be due to wind or another factor. The most unrealistic graph is for sure F. There is no way that a flag would be able to to be raised all the way to the top that quickly. You could blink and the flag would've reached the top. |
AuthorWrite something about yourself. No need to be fancy, just an overview. Archives
November 2017
Categories |
 RSS Feed
