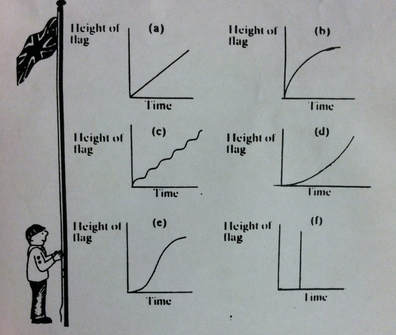
 The first graph shows how the flag raises at a steady rate, with no interruptions or stops. Graph B says that the flag is raised quickly when it starts, but starts to slow down as it begins reaching the top. Graph C says that the flag speeds up for a bit, and then slows down. Graph D shows that the flag is raised slowly over time. Graph E is saying that the flag starts out slow, then speeds up very quickly, and slows down again when it begins reaching the top. Graph F is the flag just going straight up in record breaking time.
The most realistic graph would have to be either A or D. Graph A is just showing that the flag is going up at a decent speed with no problems, while D is similar, except that the flag is going at a slower speed, which could be due to wind or another factor. The most unrealistic graph is for sure F. There is no way that a flag would be able to to be raised all the way to the top that quickly. You could blink and the flag would've reached the top.
0 Comments
Leave a Reply. |
AuthorWrite something about yourself. No need to be fancy, just an overview. Archives
November 2017
Categories |
 RSS Feed
